The motivation behind this project is to create a way to easily compare my friends' and my own Dead By Daylight Statistics. Dead By Stats is a webpage that allows you to visualize your own stats and we will often compare them. This web scraper is made so that we can compare all three at once via a graph. This is done by a github action that runs once per day on my website that runs python code made to scrap the Dead By Stats page of each of our accounts and compile the information into JSON files and commit the changes to this website's repository. The Python code uses BeautifulSoup to get the html data and parse the title of each data element and the value and store them in a JSON file.
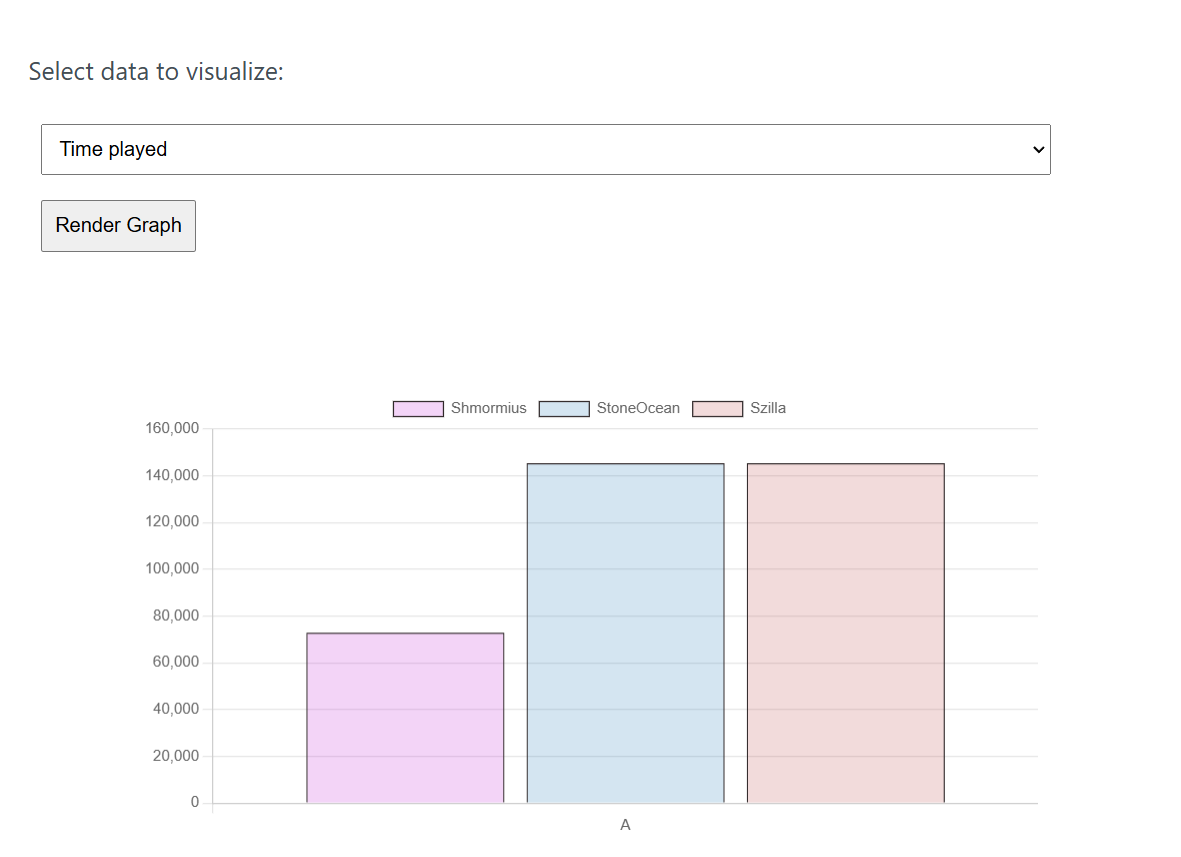
Picture of the data vizualized in the form of a graph with a dropdown button selector.